
If there is one thing I can get behind, it is using data to make better policy decisions here in NYC. So when I saw the following tweet by the 5th precinct in Manhattan, I was intrigued:
Now we could argue all day if ticketing cyclist in response to more collisions is the right thing to do here, and you will find people on both sides of the argument. A quick browse through the Twitter responses shows what many people thought. And of course the efficacy of data-driven decisions like this are a difficult thing to measure. That’s not a problem in itself because good policy does not always need to have data to back it up. But as I teach my students at Pratt, when data is being used to support a decision, it should be done with caution.
One thing that is not hard to measure is whether there really was a 115% increase in bicycle collisions. That number seemed astoundingly high to me. More than double the number of collisions from last year would indicate something has drastically changed in the neighborhood.
I am a big fan of posting raw data and methodology along with statistical claims, as “reproducibility” is a central core to the scientific method. Unfortunately, we don’t see that same philosophy being adhered to by the precinct, so I am left guessing. Even so, I took the liberty of dumping the raw collision data out of the city’s Open Data portal to put the claim to the test.
It turns out that VisionZero collision data provided by the city lacks precinct information, so I intersected that data with a police precinct spatial layer using QGIS. The following map shows the 5th precincts 2013 cycling collisions in red and 2014 cycling collisions in orange . (Both data sets are through November 21st of that year and 2013 circles are slightly large.)
At first glance, I see a lot of red and a lot of orange, but no obvious surge. So with the data in hand, I compared the cumulative monthly counts of all collisions involving bicycles in the 5th precinct from January 1st – November 21st, for both 2013 and 2014, in search of this massive uptick this year. The results:
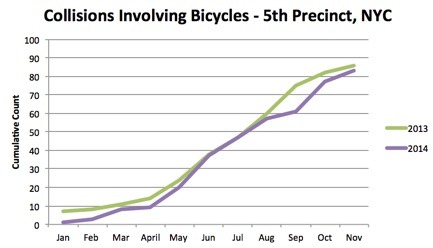
It turns out that 2013 had more collisions Year-to-date than 2014, so that must not have been what they were talking about.
2013: 86, 2014: 83
Maybe they were talking only about collisions where pedestrians were injured, since that is usually the cycle ticketing rationale:
2013: 1, 2014: 0
Maybe cyclist accidents that caused deaths, since the aim of VisionZero is to drop that number to 0?
2013: 0, 2014: 0
OK, next try. Cyclist accidents that injured drivers:
2013: 8, 2014: 2
Last one. Number of cyclist collisions where no cars were involved, since this tweet focusses on cyclists, not drivers:
2013: 0, 2014: 1
Ah ha! One reported collision that did not involve an automobile in 2014, vs zero in 2013. A number where 2014 shows an uptick. And in fact it’s an infinite percent increase.
But seriously, what gives? Well, I have absolutely no idea. Perhaps I’m missing something here and that there really is some underlying data that supports the NYPD’s assertion. (I’d be able to measure the ticket uptick as well if summons data was released publicly on the portal, but we are still waiting on that…) Data nerds: if you run the numbers yourself, and reach different conclusions, please let me know.
My ask here from the NYPD? Please, when using open data to make policy decisions, give us a hint about the underlying data and methods. Data driven enforcement decisions can have a very big impact on the citizens of this city, and if you are going to use data (which is great by the way), at the very least we deserve an explanation of where the statistic came from.
Ticket Data from NYC Open Data Portal here.
Precinct Data found here.
My filtered version of Cycling Accidents in 5th precinct is here.
h/t to Stephen Miller for tweeting about original NYPD tweet.


Sign up on lukeunfiltered.com or to check out our store on thebestpoliticalshirts.com.